
Investing in the stock market requires strategic decision-making and a clear understanding of your options. The Vanguard High Dividend Yield ETF (VYM) has become a popular choice for investors seeking stable dividend income alongside potential long-term growth. VYM tracks an index of U.S. stocks that have historically paid higher dividends than the broader market, giving you a diversified way to own established companies with strong dividend track records.
Key Takeaways
- Strategic dividend investing: VYM provides diversified exposure to high-dividend-paying U.S. stocks, holding approximately 410 large- and mid-cap companies across multiple sectors.
- Low-cost structure: A 0.06% expense ratio, a 10.5% average annual return over the past decade, and a 3.2% dividend yield make VYM attractive for income-focused investors.
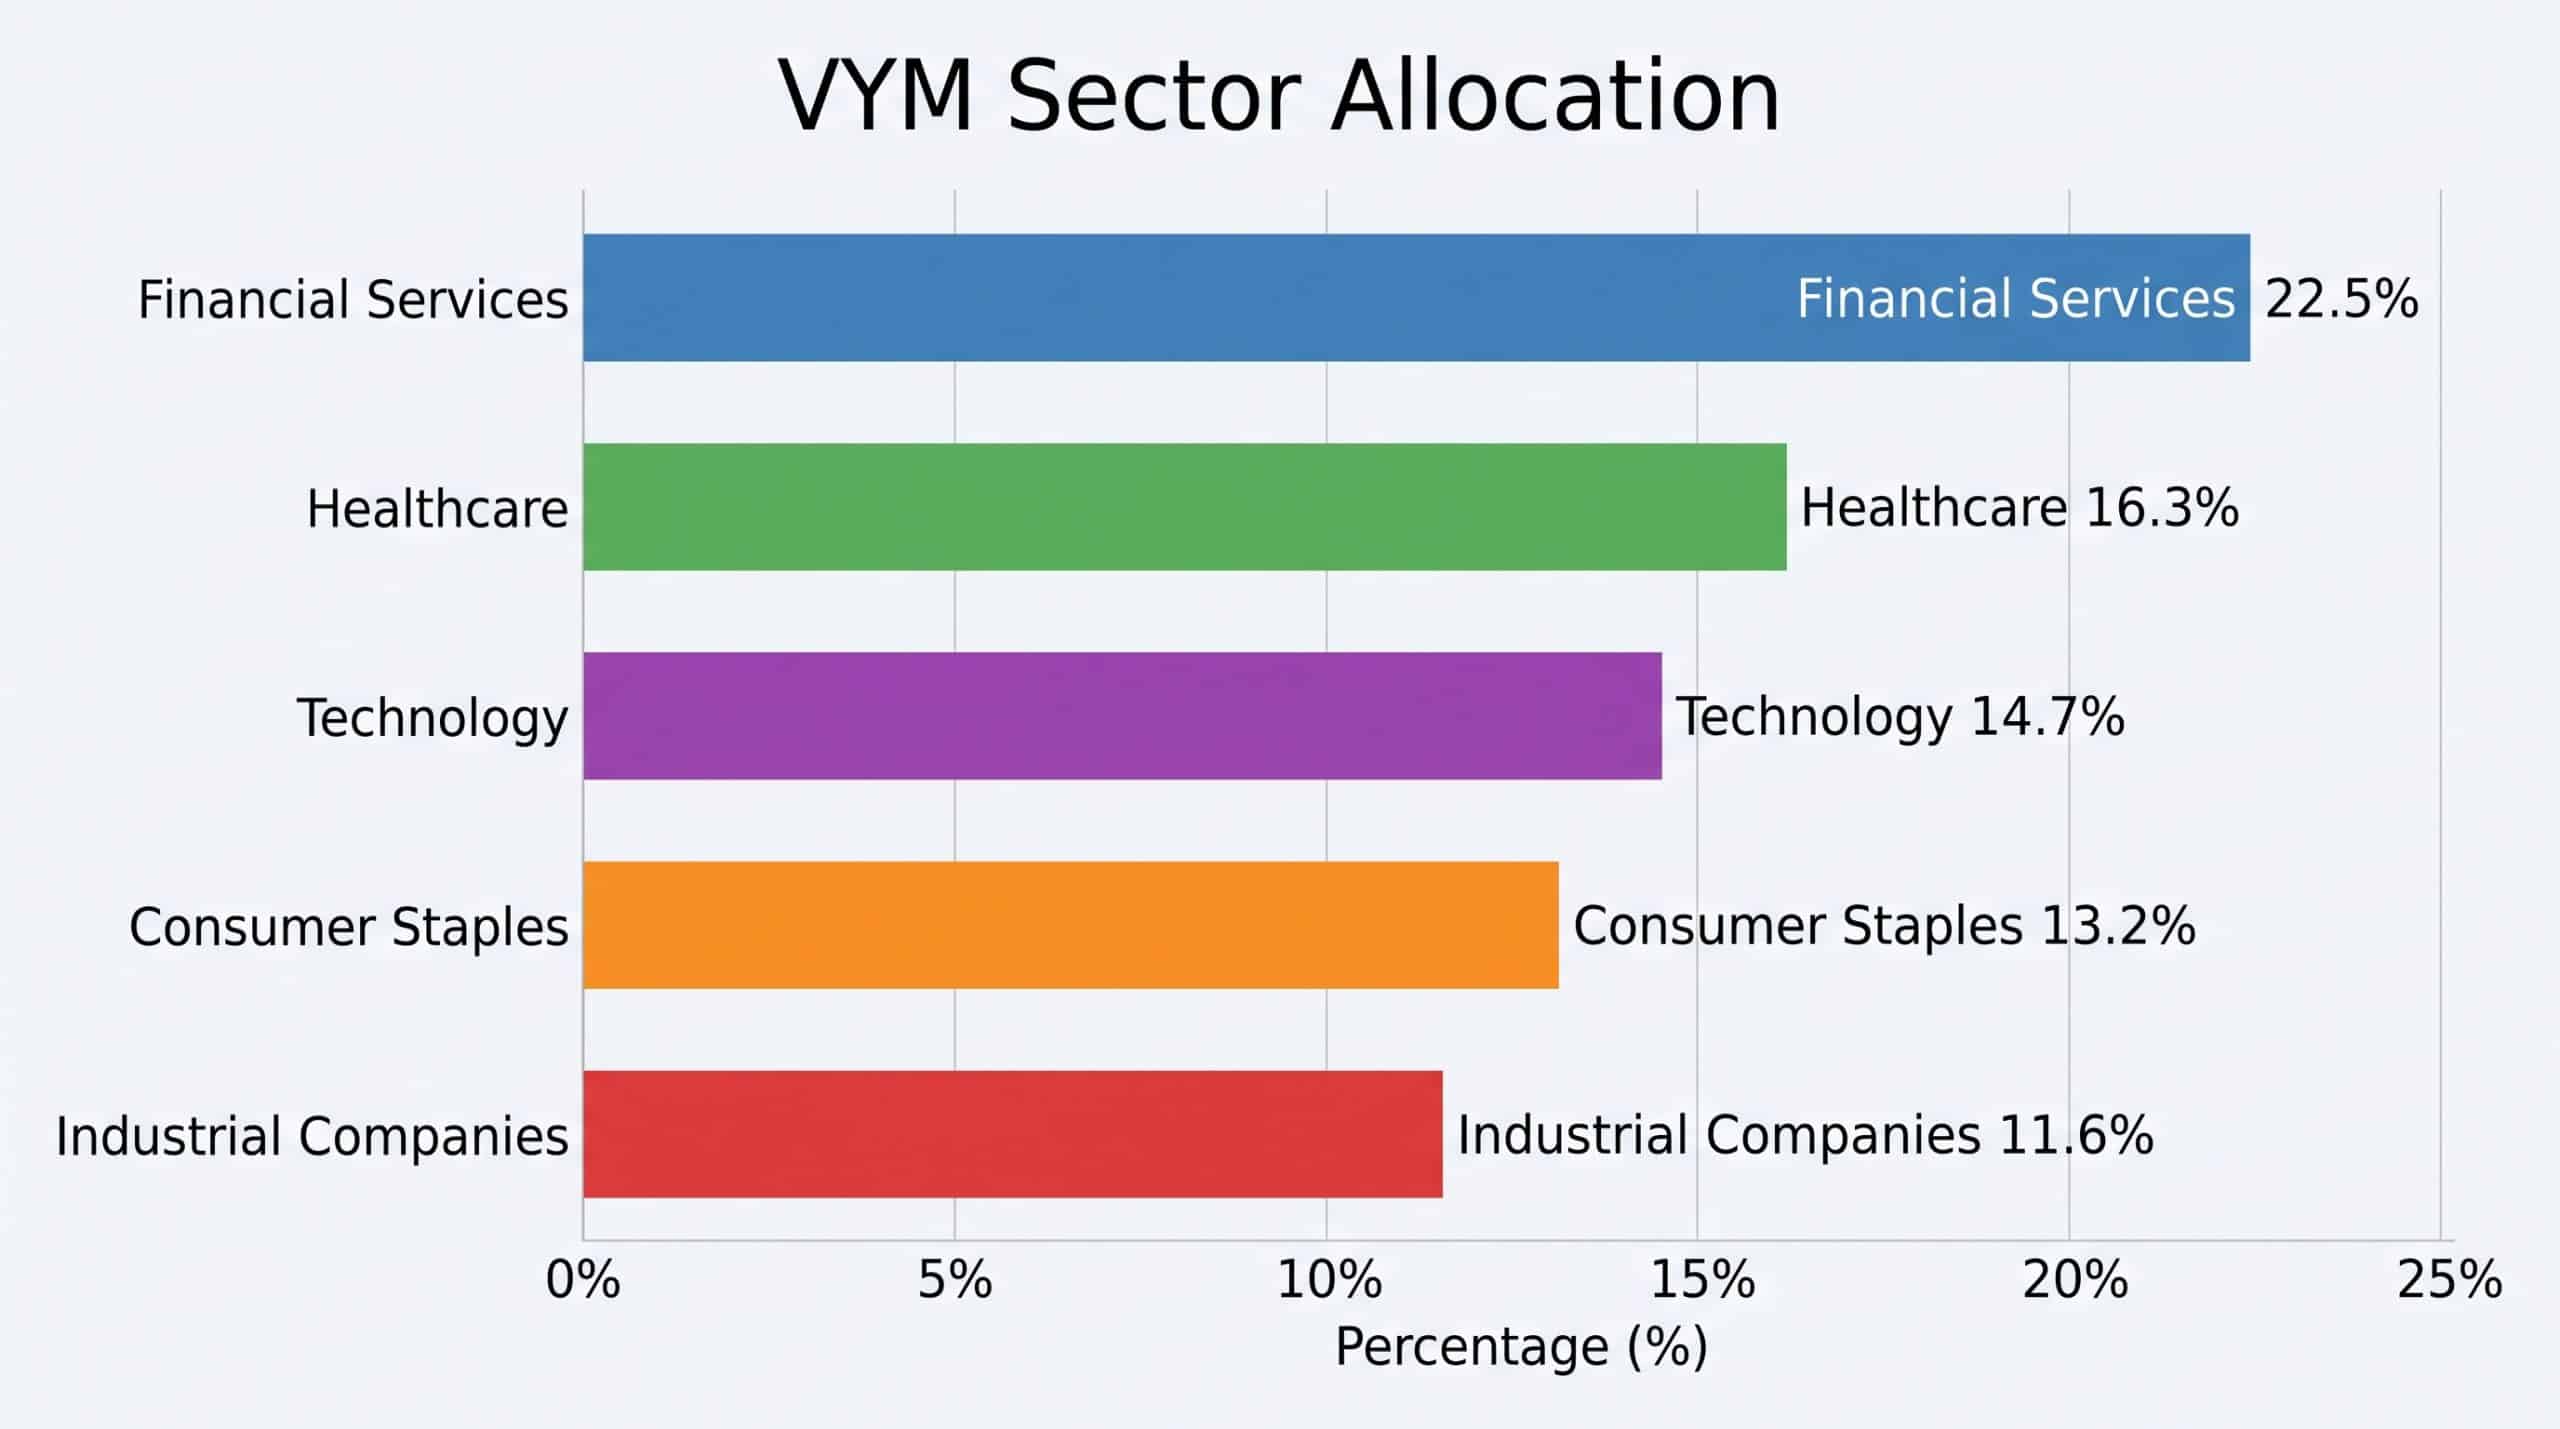
- Broad sector diversification: Allocations across financial services (22.5%), healthcare (16.3%), technology (14.7%), and consumer staples (13.2%) reduce single-industry risk.
- Blue-chip portfolio: Top holdings include Johnson & Johnson, JPMorgan Chase, and Microsoft, all established firms with consistent dividend payment records.
- Competitive position: Its extensive 410-stock portfolio and low expense ratio distinguish VYM from more concentrated dividend-focused ETFs.
Understanding the Vanguard High Dividend Yield ETF
VYM tracks the FTSE High Dividend Yield Index, which measures the return of common stocks of U.S. companies that have paid above-average dividends for the previous 12 months, excluding real estate investment trusts (REITs). The fund holds approximately 410 stocks selected from the large- and mid-capitalization segments of the U.S. equity market, and it reports total net assets of $83.097B.
| Performance Metric | Value |
|---|---|
| Expense Ratio | 0.06% |
| Average Annual Return (10-year) | 10.5% |
| Dividend Yield | 3.2% |
Investment Strategy and Composition
Vanguard’s approach centers on identifying stocks with consistently high dividend yields. The fund’s screening process:
- Evaluates companies with strong historical dividend payment records
- Excludes real estate investment trusts (REITs)
- Weights holdings by market capitalization
- Provides broad diversification across industries
Key Financial Metrics
Dividend Yield
VYM offers a dividend yield of 3.2%, distributed quarterly. In practical terms, that means roughly $3.20 in annual dividends for every $100 invested, generated through the fund’s systematic screening for dividend-paying securities with strong payment histories.
Expense Ratio
The fund’s 0.06% expense ratio is a significant advantage for cost-conscious investors, keeping more of your returns invested rather than consumed by management fees. That works out to about $0.60 in annual fees per $1,000 invested.
| Expense Ratio Comparison | VYM | Industry Average |
|---|---|---|
| Annual Expense Ratio | 0.06% | 0.44% |
| Cost per $10,000 Invested | $6 | $44 |
Portfolio Characteristics
Sector Allocation
VYM’s sector allocation demonstrates a balanced approach to dividend investing, preventing overexposure to any single industry:
- Financial services: 22.5%
- Healthcare: 16.3%
- Technology: 14.7%
- Consumer staples: 13.2%
- Industrial companies: 11.6%
Top Holdings
The fund’s largest positions are blue-chip companies selected for financial stability, reliable earnings, and sustained dividend payments:
| Company | Sector | Percentage of Portfolio |
|---|---|---|
| Johnson & Johnson | Healthcare | 3.4% |
| JPMorgan Chase | Financial Services | 3.1% |
| Procter & Gamble | Consumer Staples | 2.9% |
| Chevron | Energy | 2.7% |
| Microsoft | Technology | 2.5% |
Investment Potential
VYM’s risk profile reflects a balanced investment approach. Diversification across approximately 410 large- and mid-cap stocks reduces individual stock volatility, the 0.06% expense ratio minimizes cost drag, and the focus on established companies with consistent dividend histories favors financial stability. Its long-term growth case rests on the 10.5% average annual return over ten years, the consistent 3.2% dividend yield, and quarterly distributions that provide a regular income stream while preserving potential for capital appreciation.
Trading Considerations
VYM’s price tends to respond to broader market trends while showing moderate volatility relative to growth-oriented ETFs, reflecting its focus on high-dividend-yielding large- and mid-cap stocks. You can track daily, monthly, and annual price movements on standard financial platforms, such as the fund pages at Yahoo Finance and Nasdaq, when evaluating an entry point or assessing its role in a diversified portfolio.
How VYM Compares With Similar ETFs
VYM competes with several prominent dividend-focused ETFs:
- iShares Core High Dividend ETF (HDV): a similar focus on high-quality dividend stocks, a slightly higher expense ratio at 0.08%, and a smaller portfolio of approximately 75 holdings.
- SPDR Portfolio S&P 500 High Dividend ETF (SPYD): about 80 holdings, a higher dividend yield around 4.1%, and a more aggressive sector allocation strategy.
- Schwab US Dividend Equity ETF (SCHD): a comparable 0.06% expense ratio, strict dividend growth criteria, and a more concentrated portfolio of roughly 100 stocks.
| Metric | VYM | Competitor Average |
|---|---|---|
| Expense Ratio | 0.06% | 0.10-0.25% |
| Number of Holdings | 410 | 75-150 |
| Average Annual Return | 10.5% | 8.7-9.5% |
| Dividend Yield | 3.2% | 2.8-3.5% |
VYM’s broader diversification across 410 stocks provides more comprehensive market exposure than its more concentrated competitors, while its low expense ratio and systematic screening process help capture reliable dividend streams with minimal management overhead.
Frequently Asked Questions
What is the Vanguard High Dividend Yield ETF (VYM)?
VYM is an exchange-traded fund that tracks the FTSE High Dividend Yield Index, holding approximately 410 large- and mid-cap U.S. stocks known for above-average dividend payouts across sectors such as financial services, healthcare, technology, and consumer staples.
How does VYM select stocks?
The fund uses a systematic screening process that excludes REITs and focuses on companies with strong historical dividend payment records, weighting holdings by market capitalization.
What is VYM’s dividend yield?
VYM offers a 3.2% dividend yield with quarterly distributions, roughly $3.20 in annual dividends for every $100 invested.
What is VYM’s expense ratio?
The expense ratio is 0.06%, or about $0.60 in annual fees per $1,000 invested, well below the 0.44% industry average.
How has VYM performed historically?
VYM has delivered a 10.5% average annual return over the past decade, combined with its consistent 3.2% dividend yield.
What are the risks of investing in VYM?
Potential risks include market volatility, sector-specific challenges, interest rate fluctuations, and changes in dividend policies at portfolio companies. Consider your risk tolerance and investment goals, and research thoroughly before investing.
Conclusion
VYM offers a strategic path to consistent dividend income and long-term financial growth through a diversified portfolio of established U.S. companies with proven dividend records. Its low expense ratio, balanced sector allocation, and systematic stock selection make it a compelling option whether you are a seasoned investor or just beginning to explore dividend-focused strategies.