Are you new to trading Ethereum?
You’re in luck.
This article will give you a crash course in understanding Ethereum price charts.
Price charts are an essential tool for traders, and understanding them is key to making informed decisions.
In this article, we’ll discuss what Ethereum is, the key features of price charts, and how to interpret chart patterns.
Let’s get started!
What is Ethereum?
Ethereum is a digital currency that you can use to make payments and investments – it’s kinda like your own digital cash! It was created in 2015 by Vitalik Buterin.
It is a decentralized platform that runs smart contracts. Ethereum is the second largest cryptocurrency in the world. It can be used as a store of value, to create decentralized applications, and to make payments.
It is also used to pay for transaction fees and services on the Ethereum network. Ethereum price charts are available to view online. They show the current and historical prices of Ethereum. Beginners can use these charts to get a better understanding of the Ethereum market and to track the price of Ethereum over time.
Understanding Ethereum Price Charts
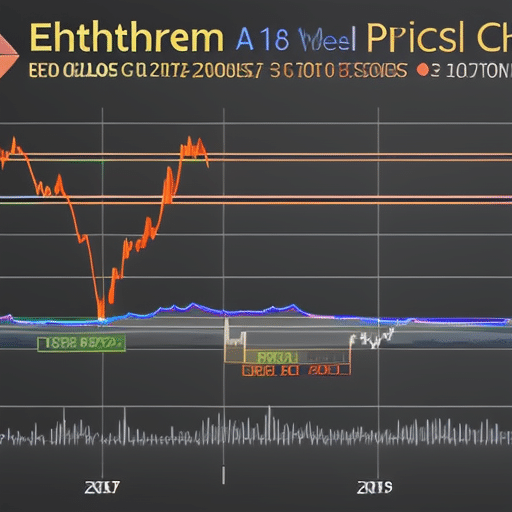
Seeing the fluctuations of cryptocurrency can be intimidating, but understanding the information these charts provide can help you make more informed decisions.
Ethereum price charts can show you the current and historical prices of Ethereum, as well as the market capitalization of the cryptocurrency. It’s important to note that the prices in the chart are based on fiat currency, like the US dollar, and not on other cryptocurrencies.
You should also pay attention to the trading volume of Ethereum, as this can indicate the amount of people buying and selling Ethereum, and can be an indicator of future price movements.
The chart also displays the total market capitalization of Ethereum, which is a measure of how much all Ethereum in circulation is worth. This can be helpful to track the overall value of Ethereum, as well as to compare it to other cryptocurrencies.
Additionally, you can use the chart to compare Ethereum to other fiat currencies, such as the US dollar. By looking at the chart, you can quickly see which direction the price of Ethereum is heading and make more informed decisions about investing.
Key Features of Price Charts
Understanding the key features of Ethereum price charts can be essential for experienced investors looking to make informed decisions.
Ethereum price charts include several key features to help understand the current and past performance of the cryptocurrency. The most commonly used feature is the candlestick chart, which shows the opening and closing prices during a given period, as well as the highest and lowest prices of that period.
Additionally, Ethereum price charts also show the trading volume, and often the volume of ETH bought and sold during the period. Other features include price movements (the difference between the current and previous closing prices) and various indicators that help investors identify trends.
All of this information can be used to make more informed decisions about when to buy or sell Ethereum. Additionally, understanding the various features and indicators of Ethereum price charts can help investors identify potential entry and exit points, and better manage risk.
Interpreting Price Chart Patterns
Interpreting price chart patterns can be a fun way to gain insight into the Ethereum market. Price charts often display patterns that can provide hints about where the market is headed.
One of the most common patterns is the head-and-shoulders pattern. This occurs when a price reaches a peak, then drops, then rises again before dropping to a lower level than the initial peak. This is an indication of a trend reversal and could be a signal to prepare for a reversal in the Ethereum market.
Another pattern to look out for is the triangle pattern. This is when the price moves in a narrower and narrower range, and then breaks out of this range in either direction. This too can be an indication of a trend reversal, and may be a signal that the Ethereum market is about to move in the direction of the breakout.
Making Informed Trading Decisions
Making informed trading decisions can be tricky, even for experienced traders. To become a successful Ethereum trader, you must be able to interpret price chart patterns and then use these patterns to make decisions about when to buy and when to sell.
It is important to understand that the price of Ethereum can be affected by a variety of factors, including market news, technical analysis, and even the emotions of other traders. Before making any trading decisions, make sure you understand the risks associated with trading Ethereum and have done your own research to make sure you’re making a wise decision.
In addition to understanding the risks and doing your own research, it’s also important to have a good understanding of the different types of orders available when trading Ethereum. For example, a market order will execute your transaction immediately at the current price, whereas a limit order will allow you to set a price at which you’d like to buy or sell.
Additionally, there are other types of orders that may be available depending on the exchange you’re using. Knowing the different order types can help you make more informed and profitable trading decisions.
Conclusion
It’s clear that Ethereum price charts can provide valuable insight into the market.
They can help you understand key trends and make informed trading decisions.
With a bit of practice and dedication, you can be a successful Ethereum trader in no time.
So, take the time to study and understand price charts, and you’ll be well on your way to achieving success.
Good luck!