
Ethereum is the second-largest cryptocurrency by market capitalization, and even a small slice of a coin changes in dollar value from minute to minute. If you hold or plan to buy 0.01 ETH, knowing what that fraction is worth — and how to follow it properly — helps you time decisions, size positions, and understand the risk you are taking on. This guide covers recent reference quotes, why price trackers disagree with each other, and how to read the charts and market forces behind the number.
What Is 0.01 ETH Worth Right Now?
Because Ethereum trades around the clock, the only dependable answer comes from a live tracker checked at the moment you need it. Recent tracker quotes still give useful reference points: Revolut’s ETH-to-USD converter listed 0.01 ETH at $25.44, with 1 ETH priced at $2,543.54, while Paybis quoted 1 ETH at $2,475.30 — putting 0.01 ETH at $24.75 — on Sep 7, 2026. Treat any figure printed on a static page as a snapshot rather than a live quote, and confirm the current value before acting on it.
Why 0.01 ETH Quotes Differ Between Trackers
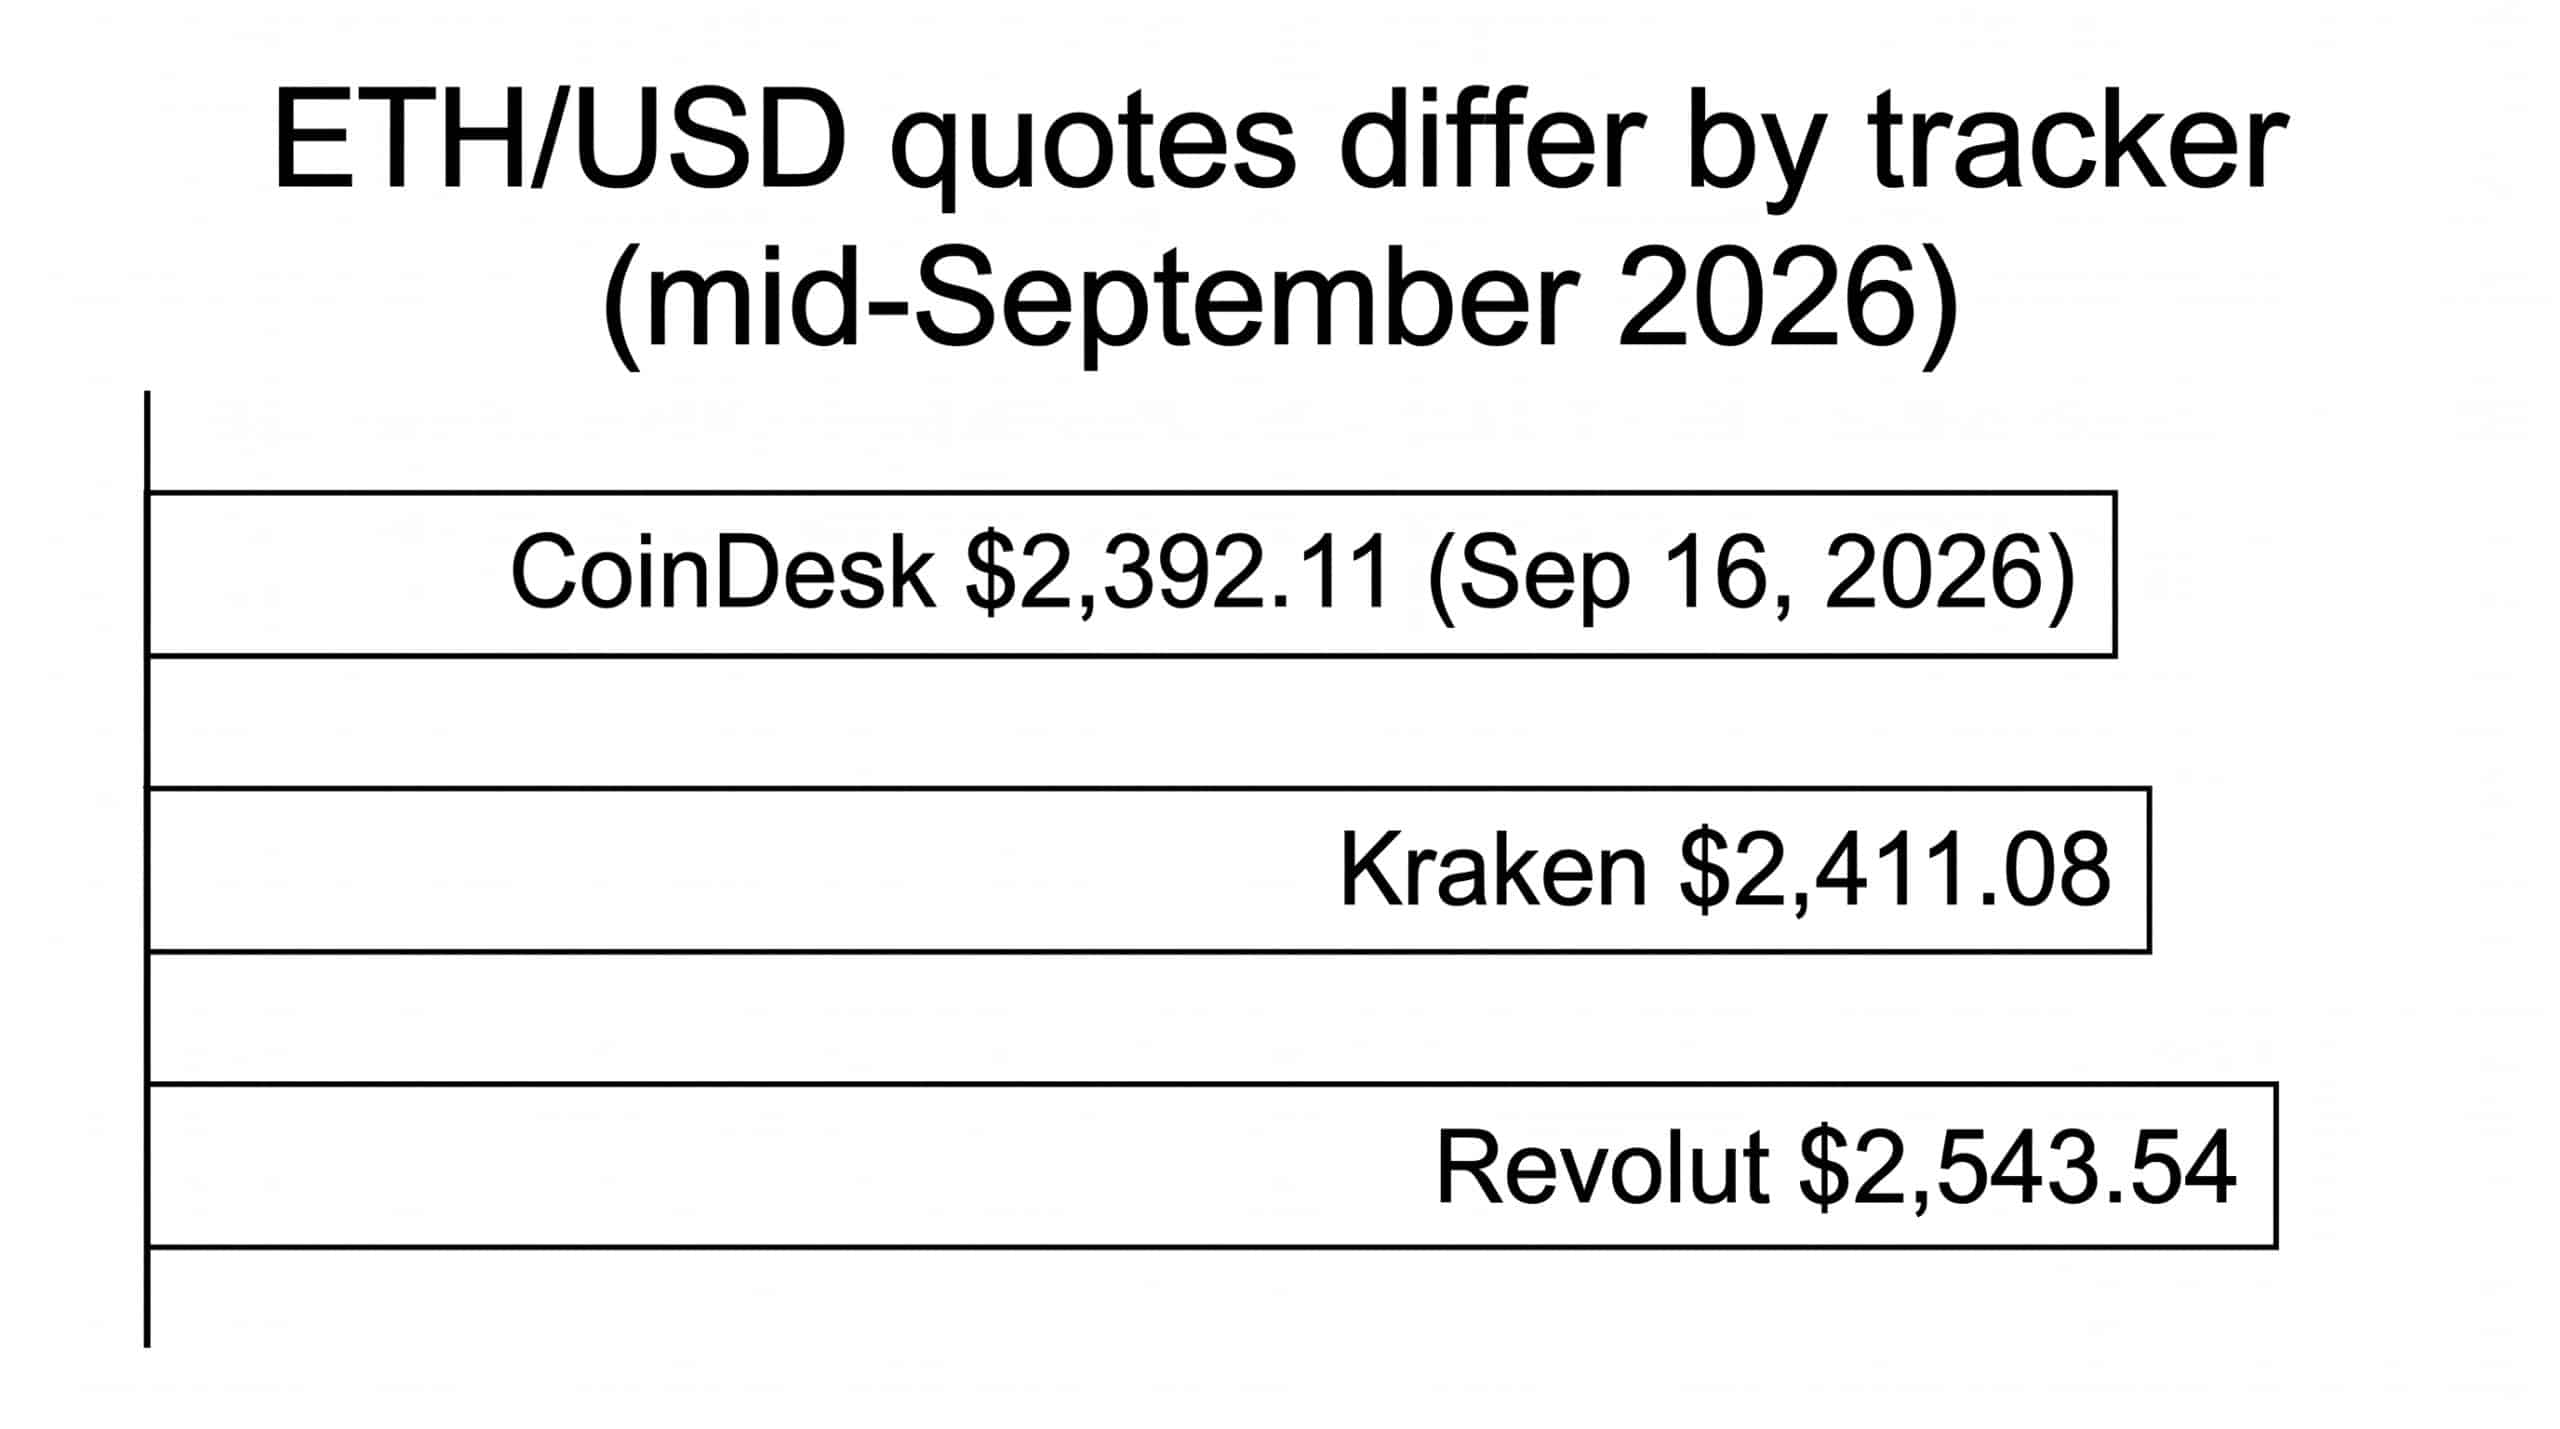
Open several price pages side by side and you will rarely see the same number. In mid-September 2026, published ETH/USD quotes ranged from $2,392.11 on CoinDesk, timestamped Sep 16, 2026, to $2,543.54 on Revolut, with Kraken quoting $2,411.08. Each platform publishes its own figure on its own schedule, so check the timestamp attached to any quote you rely on, and when you compare movements over time, stay with a single tracker so you measure like against like.
Why Track the Price of 0.01 Ethereum?
Following the value of a small fraction rather than a whole coin has practical benefits. It lets you assess small-scale price trends over a given period, which supports more accurate market analysis and better-informed decisions about when to buy or sell. Short-term traders can act on meaningful intraday moves in the fraction they actually hold, and understanding how micro price movements reveal larger macro trends helps longer-term investors judge where the market may be heading. It also deepens your working knowledge of how cryptocurrency markets and blockchain technology behave without requiring a large commitment of capital.
Reading Charts and Spotting Trends
Price graphs and charts condense the market into a handful of variables: trading volume, opening and closing prices, and highs and lows. Reading them well means separating short-term fluctuations from long-term trends and considering how outside forces — economic conditions and political events among them — may be shaping the pattern you see. Volume deserves particular attention: rising volume typically signals growing interest in an asset, while falling volume can signal waning interest. Trend-spotting builds on this foundation; recognizing recurring patterns helps traders decide when to enter or exit a position and where to place stop-loss orders that limit damage from sudden moves.
What Moves the Price
Ethereum’s price responds to supply and demand, economic news, and geopolitical events. Market sentiment is often highly correlated with daily changes in the price, while geopolitical events show a much lower correlation because of their unpredictable nature. The result is a volatile market: Robinhood notes that Ethereum has swung from a yearly high near $3,100 to a February low. Swings of that scale can cause significant losses for inexperienced traders who cannot keep up with rapid changes, which is why understanding these forces matters before you commit money.
Technical and Fundamental Analysis
Complementary toolkits help you interpret the number on the screen. Technical analysis studies past price action — charting patterns, momentum indicators, moving averages, and support and resistance levels — to identify potential entry and exit points. Fundamental analysis examines the forces underneath: trade volume, market depth, supply and demand dynamics, economic indicators, and political events. Combining both approaches gives a fuller picture than either alone and helps explain why the price is where it is, not just where it has been.
Managing Risk When Trading Small Amounts
Even a position of 0.01 ETH deserves a plan. Diversifying across different cryptocurrency assets and markets reduces exposure to any single source of risk. A stop-loss order closes your position automatically if the price falls to a predetermined level, sparing you further losses if the market moves against your position. Automated trading systems can execute buy and sell decisions against preset criteria, removing emotion from the process and reducing the chance of rash decisions during volatile stretches. Short-term approaches carry higher risk with the potential for quicker returns; long-term approaches trade slower growth for steadier value. Research current market trends and any regulatory requirements in your region before trading, and remember that no strategy removes risk entirely.
Tips for Monitoring the 0.01 Ethereum Price
Automated tracking tools deliver real-time updates on price movements so you can act quickly in fast-moving markets, and a portfolio tracker lets you monitor holdings across multiple exchanges from a single view. Pair those tools with the habits above — check timestamps, use a consistent source, and watch volume alongside price — and the live 0.01 Ethereum figure becomes a signal you can actually use rather than a number that merely changes.